Chasing A Narrative
Working with question headings, then, we can look at some of the more popular examples, such as those relating to hospital appointments, including hospital waiting lists.
Waiting list data are available on the Government’s open data website and the HSE publishes a non-exhaustive list of major hospitals at the same source.
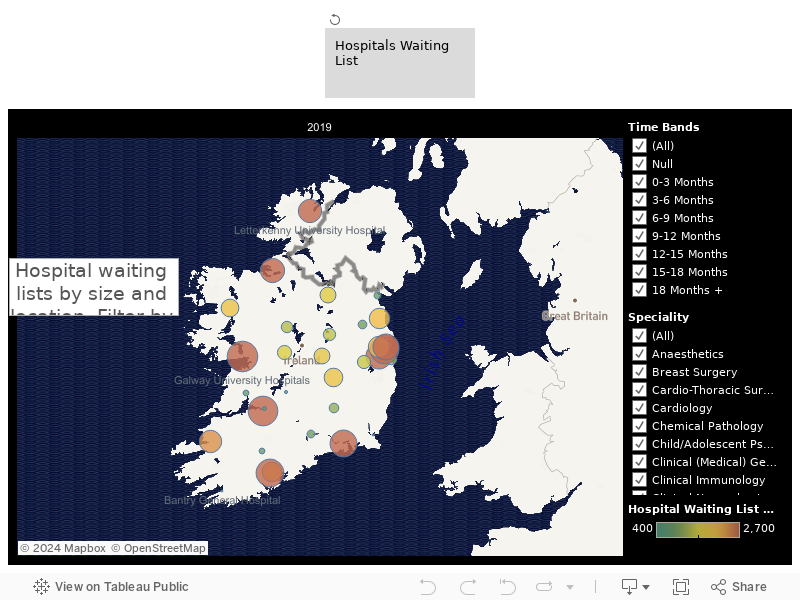
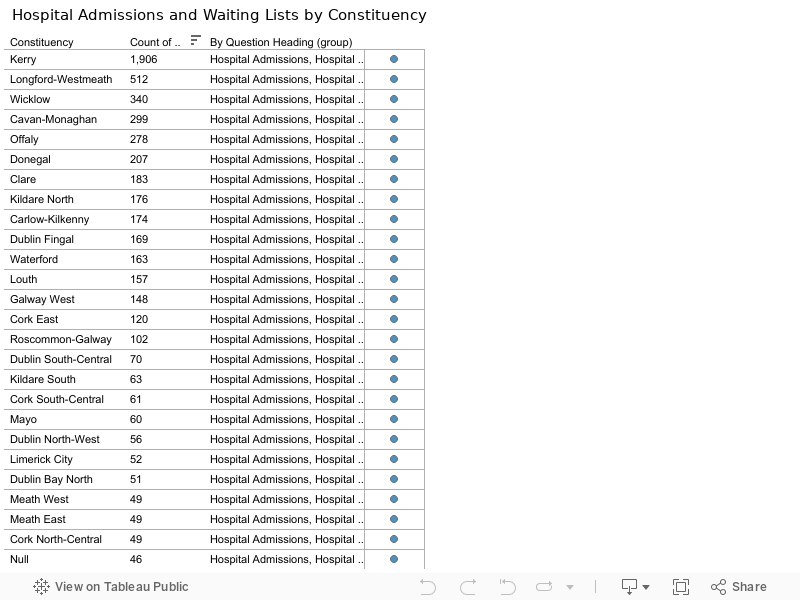
The constituencies visualisation can be customised to categorise by number of health questions asked or even filter by question headings relating to hospital admissions or waiting lists, adding further detail by mapping the locations of the major hospitals.
In this example, the greatest number of questions to the Department of Health comes from the Kerry constituency with Deputy Michael Healy-Rae asking by far the greatest number of questions of the Department. However, over half of the questions relate to hospital appointments or waiting lists, despite hospital waiting lists being by no means concentrated in the Deputy’s constituency or its environs.
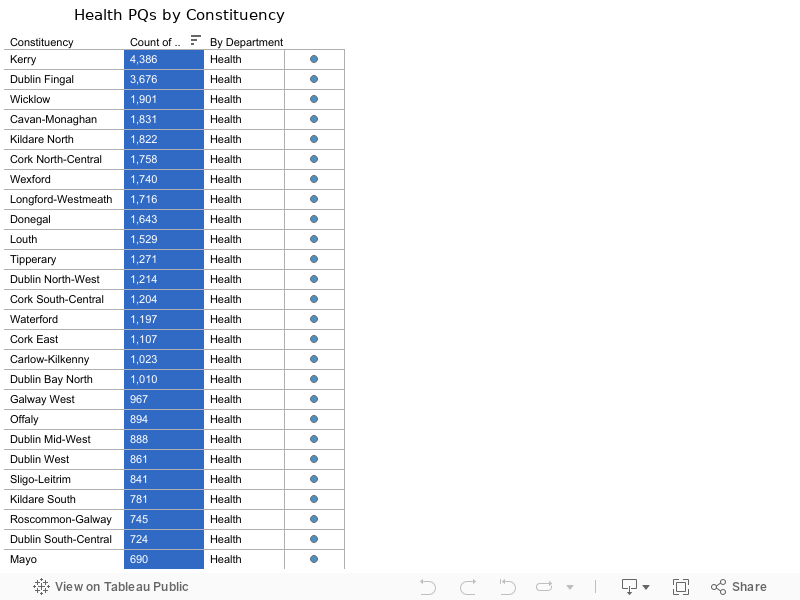
Ultimately, Deputy Healy-Rae asked more questions relating to hospital appointments and waiting lists than the combined health questions submitted by the public representatives in 32 of the 39 other constituencies.
This example implies that PQ data, especially when combined with complementary spatial or sectoral data, can provide rich detail on the interests and motivations of our public representatives. The example of Deputy Healy-Rae is extreme but there is no reason the pattern of analysis could be replicated, in full or in part, with most Dáil Deputies.
They work for you and ask questions on your behalf; you should really know what they are asking.